Data is one of the most important parts of every research and exploration work, but it can’t give you many insights alone. Data visualization allows you to turn it into a visual representation that you can explore with your eyes, a sort of information map. Today, I will share the five best libraries for data visualization that you can use in your Python projects. So, without any further ado, let’s get started..!!
Contents
5 Best Python Libraries For Data Visualization
1. Matplotlib
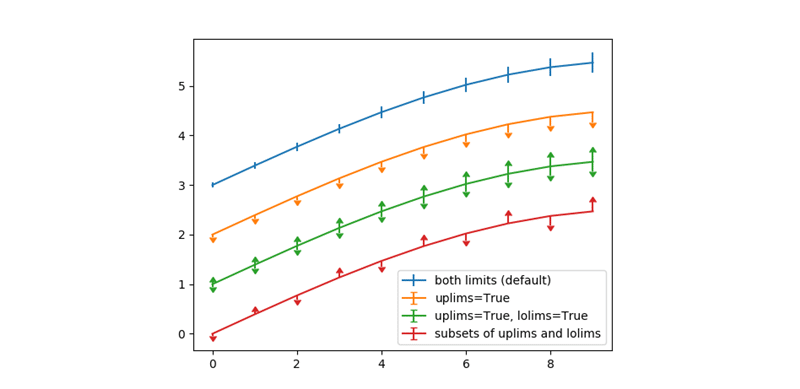
Matplotlib is the most popular Python library for data visualization. It can be used in Python and IPython shells, Python scripts, Jupyter Notebooks, web application servers, etc. It’s a more than 10 years old 2D plotting library that comes with an interactive platform.
You can use this library for multiple purposes such as generating plots, bar charts, histograms, power spectra, stemplots, pie charts, and more. The best thing about Matplotlib is you just have to write a few lines of code and it handles the rest by itself. Metaplotilib focuses on static images for publication along with interactive figures using toolkits like Qt and GTK.
2. Seaborn
Seaborn data visualization library is also based on Matplotlib. If you are looking for some more advanced options for your work, try this python library. It comes with a fully-featured interface for drawing attractive and informative statistical graphics. Its API for creating KDE-based visualizations is more concise than others.
Seaborn is working hard to make visualization a central part of understanding and exploring data. Its dataset-oriented plotting functions run on data frames carrying whole datasets. Seaborn internally performs the necessary semantic mapping and statistical aggregation to provide informative plots. Lastly, Seaborn is fully integrated with the PyData stack including support for NumPy and pandas data structures.
Also Read: 5 Best Open Source IDEs For Python Developers
3. Altair
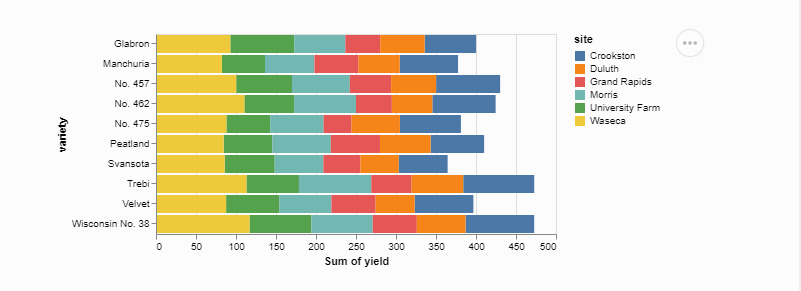
It’s a declarative statistical library built on top of the popular Vega-Lite visualization grammar. Altair is friendly, consistent, and comes with a simple API. Using this data visualization library, you can create beautiful and effective visualizations with a minimal amount of code. If you don’t know, a declarative library needed to be mentioned only one link between the data columns to the encoding channels, and the rest will be handled automatically. You can check the official repository of Altair on Github.
4. Plotly
Plotly is a web-based data visualization toolkit that comes with unique functionalities such as dendrograms, 3D charts, and also contour plots, which is not very common in other libraries. It has a great API offering scatter plots, line charts, bar charts, error bars, box plots, and other visualizations. Plotly can even be accessed from a Python Notebook.
5. ggplot
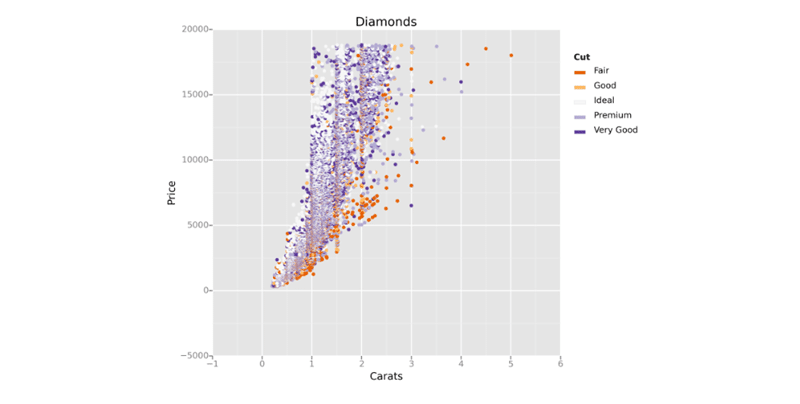
ggplot is a system for creating graphics declaratively. It’s based on the Grammar of Graphics of R programming language and is tightly integrated with Pandas. ggplot just requires you to declare how to map the variables to aesthetics and primitives to use and handles the rest automatically. Remember, ggplot is not recommended for creating highly customized graphics.
Recommended: Top 5 Best Bug Fixing Tools For Python Developers
Final Words
That’s it for this article. If you are looking for a python library for data visualization, first know your requirements clearly and then choose any of the above libraries seamlessly. If you know any other library that deserves a place in this list, do let us know in the comments below.


